We are reproducing this important analysis by economist Michael Burke from Socialist Economic Bulletin, with permission.
The Communist Party of China was founded on July 1, 1921. In a short series of graphs this note aims to highlight some of the consequences of that decision for China and the world. In particular, the trends in rapid growth in Chinese living standards after the Chinese Revolution is highlighted in a way that is designed to be more readily understood in societies where nothing similar to this has taken place over a similar timescale.
Background
The Communist Party of China was founded after a series of attempts by young radicals and nationalists to agitate against foreign domination of the country. In 1839, Britain invaded China and there followed a ‘century of humiliation’ as it was territorially and economically carved up among the Western imperial powers.
One aspect demonstrating the degree of that humiliation was the enormous decline in living standards under British Empire-led rule. This is shown in Chart 1 below (all data from Angus Maddison, unless otherwise stated).
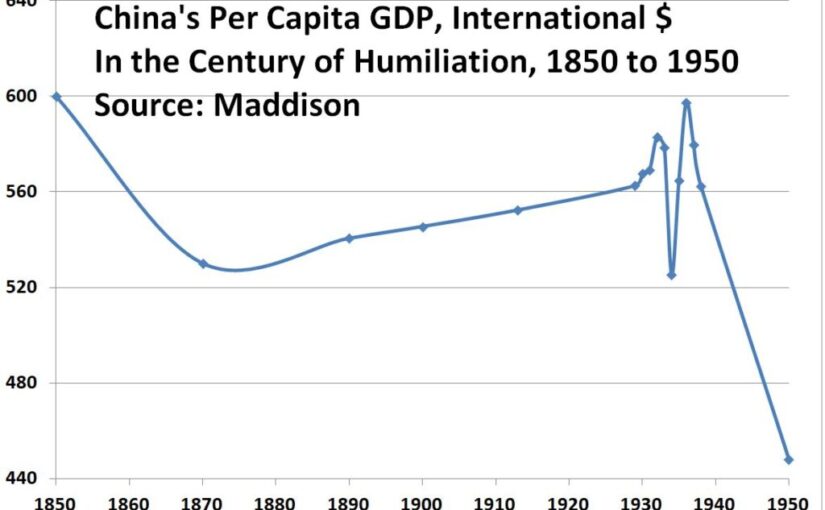
Chart.1 Per Capita GDP in China in the Century of Humiliation, Int’l $
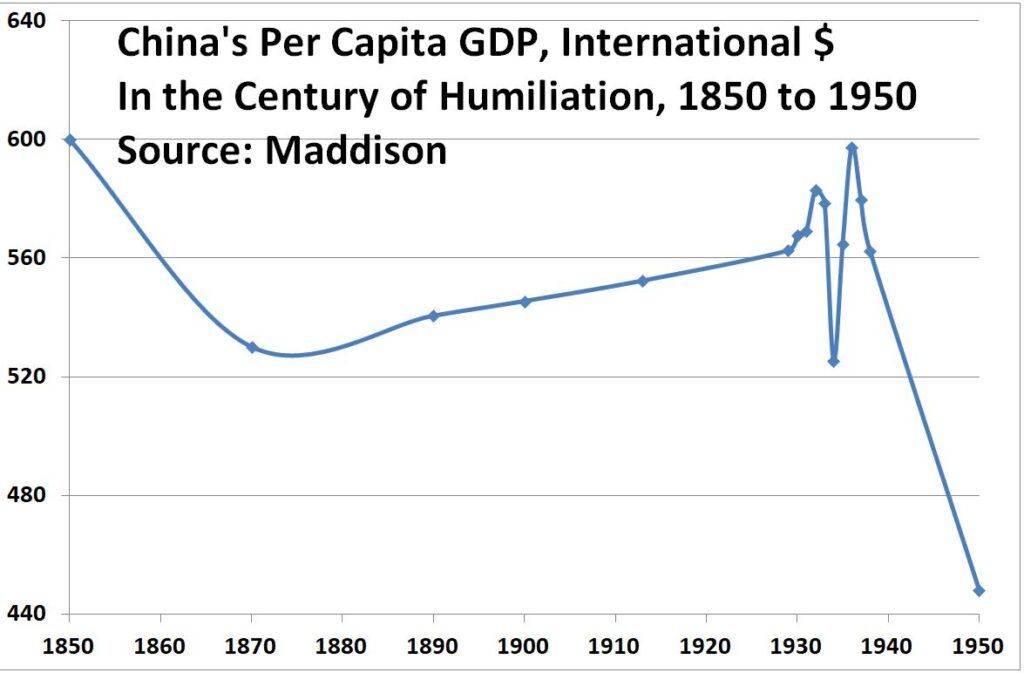
Under rule by foreign powers, China’s per capita GDP fell over a period of a hundred years (1850 to 1950) from $600 to $448. By contrast, and for comparison, British per capita GDP rose from $2,330 to $6,939 over the same period.
Later success
The CPC’s first great achievement, and the necessary first step for all later development, was its ability to expel the foreign colonialists, culminating the Revolution of 1949. Chart 2 below extends the first chart to the modern period, up to 2008, to the time Maddison’s death.
Between 1950 and 2008 China’s per capita GDP rose from $448 to $6,725. So, in 100 years of colonial and capitalist rule, living standards fell by over 25%. Yet in 58 years after the Revolution per capita GDP rose by 14 times. To bring matters up to date, the World Bank (which uses a different, but consistent measure of international purchasing power) which estimates that per capita GDP rose a further 128% from 2008 to 2019. This implies a cumulative growth in output of between 1950 to 2019 of 33 times.
Chart 2. China’s Per Capita Incomes, 1850 to 2008

One of the stranger arguments about the current Chinese economic system is that it is capitalist, in part reflecting an inability or unwillingness to accept prosperity as an aim or product of socialism. Oddly, on both left and right can be found arguments that imply or explicitly state that China’s prosperity is a product of capitalism.
Yet China was opened up to capitalism for 100 years and it was an economic disaster. It was only when the CPC led the peasants and workers to power that economic development was possible, and the scale and pace of the development since has been astonishing.
Success in a global, historical comparison
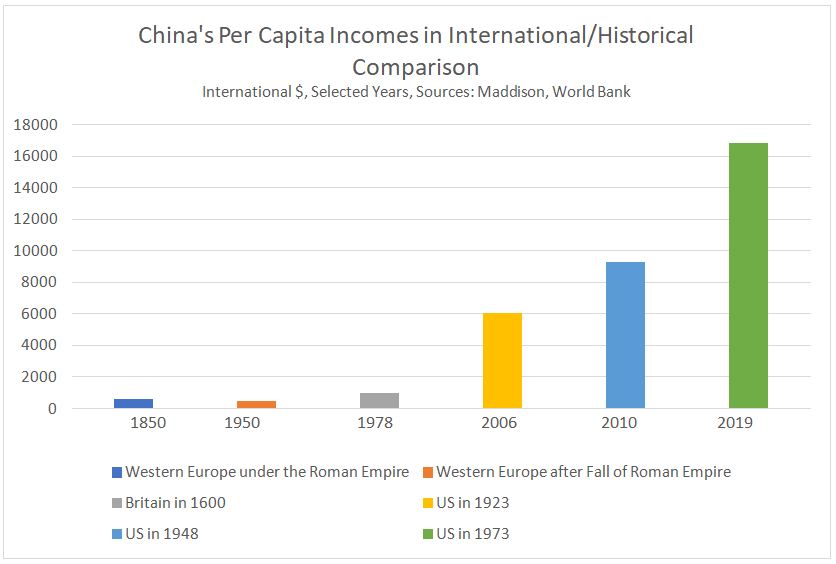
It is difficult in richer societies to imagine both the scale and pace of that transformation. Therefore, it may be useful to demonstrate both of these in relation to historical comparisons. Chart 3 below is based on the same data as in Chart 2. But in addition, it uses as reference points the estimates for per capita GDP provided by Angus Maddison for a variety of societies and over different historical periods.
The purpose is to highlight some important milestones on China’s path of economic development, and to give an indicator of its pace. All comparisons are the author’s, not Maddison’s.
Chart 3. International Comparisons of China’s Per Capita Incomes, International $
It is important to dispel any notion that this was an inevitable process, independent of any policy decisions and simply a reflection of ‘catch-up’ that often occurs to all extremely poor nations. This can be done in 3 ways:
- When Britain led the foreign invasion and carve-up of China in 1840, in the century that followed there was no catch-up as per capita GDP actually fell (to a level seen in Western Europe after the fall of Rome and the barbarian invasion).
- Within the era following the Revolution there are distinctive periods of growth which themselves reflect policy decisions. In particular in the period from 1950 to 1978 per capita GDP grew strongly, by 118%. However, in the following 28 years through the ‘reform and opening up’ process, per capita GDP grew much more rapidly, by 518%.
- International comparison shows that similar countries, including ones which had liberated themselves from Empire, did not grow nearly as rapidly. This is highlighted in Chart 4 below, in the comparison of modern trends in per capita GDP in India and in China.
Chart 4. China and India, Per Capita Incomes, US current $ at Purchasing Power Parities
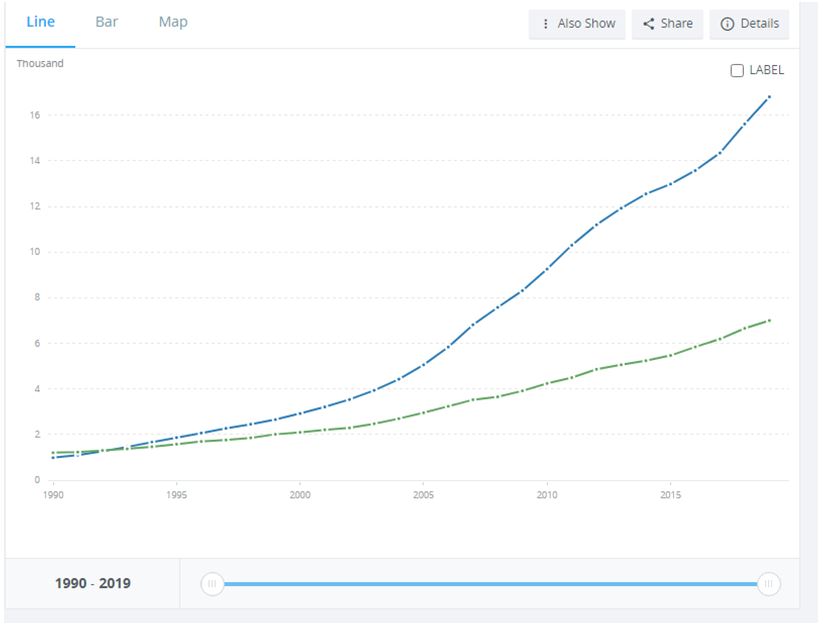
Source: World Bank
In 1950, very shortly after both the Chinese Revolution and Indian Independence, India’s very low per capita GDP was still considerably higher than China’s in percentage terms. According to the Maddison data GDP per capita GDP was $619 in India versus $448 in China (in International $ terms). Both countries grew far more rapidly than they had under colonial rule.
However, China pulled level with India in 1992 and more rapid growth meant that it had reached a per capita GDP of $16,804 in 2019, 140% greater than in India.
Conclusion
In 1921 when the Communist Party of China was formed 474 million Chinese were attempting to subsist on per capita GDP of something less than $600 per year. Now there are 1.4 billion Chinese citizens with a per capita GDP of almost $17,000 in 2019.
The CPC inherited a level of output comparable to the living standards in Western Europe after the fall of the Roman Empire in the West. Within 70 years, a single lifetime, a rise in per capita incomes has taken place which either took millennia in other countries, or which, unfortunately many other countries are still very far from achieving.
Naturally, many people in those countries will be keen to examine the main factors responsible for such a transformation in living standards, with the aim of learning from them and adapting them to local conditions where possible. Anyone interested in economic development, or increasing living standards, or socialism will want to do the same.
These 4 charts are not designed to identify those main factors driving exceptional growth, but simply to provide a very small snapshot of the effects of policies and structures which were aimed at raising living standards and to encourage study of these issues.